Part:BBa_K316003:Experience
This experience page is provided so that any user may enter their experience using this part.
Please enter
how you used this part and how it worked out.
Applications of BBa_K316003
- The enzymatic reaction catalysed by C2,3O is an ideal output signal for our engineered bacterial detector and it can also serve as a very useful reporter gene.
- Catechol, the substrate of C2,3O, is colourless. However within seconds of its addition, the colonies/liquid cultures of XylE-expressing cells become yellow, indicating production of a product which absorbs light in the visible spectrum
This characterization experiment is made by METU_Turkey 2014 Team:

User Reviews
UNIQf963f7940210f981-partinfo-00000000-QINU
|
•••••
Imperial College iGEM 2010 |
|||
|
Absorbtion spectrum assay The spectra showed that in XylE transformed cells, a broad peak appears at about 380nm. The absorbance at this particular wavelength is by the product of the C2,3O reaction which is called 2-hydroxymuconic semialdehyde and is what causes the yellow output. |
|||
|
2-hydroxymuconate semialdehyde production rate Data that delineate the course of the reaction in terms of yellow product production over time at various catechol concentrations. The results of one of these assays is presented in the figure below. In order to extract data that will allow characterization of the kinetic parameters of catechol dioxygenase enzyme our lab team proposes purification of the protein from cell lysate, several fold dilution, and in vitro characterization. |
|||
|
Cytotoxicity of Catechol Growth with Catechol (LB) The addition of catechol had distinctive effects on the XylE expressing cells growing in LB medium. While at 0% catechol growth-behavior did not show a significant change (dark blue), even the lowest concentration of 0.25% catechol appeared to drastically reduce cell-survival (red). In contrast, CMR-control cells did not change their growing behavior in the presence of catechol. From this we conclude that in LB medium, the breakdown product of catechol, 2-hydroxymuconic semialdehyde, has a lethal effect on E. coli. |
|||
|
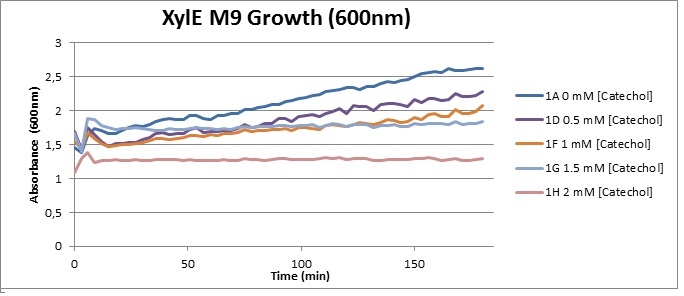
(M9) Cells growing in M9 medium appeared more resistant to the effects of catechol. With absorbance at 380 nm increased significantly in well containing XylE expressing cells, indicating strong turnover of Catechol by C2,3O (4), Catechol showed strong influence on growing behavior in generalizable fashion: increasing concentrations of catechol progressively inhibited cell population growth. However, the overall effect of the breakdown product HMS appeared less severe than compared with the LB – XylE samples. |
|||
|
C23O kinetics The Michaelis-Menten curve was delineated by non-linear regression analysis using GraFit software tool. The calculated Km is 0.71mM catechol (with a Vmax of 3.37 in O.D. arbitrary units for this dilution of cell lysate). |
|||
UNIQf963f7940210f981-partinfo-00000002-QINU


